The Skew #
Most of the conversations I had started the same way: "So, OK, performance," I said, "what does it mean to you?" Most of the time the developer would say something along the lines of "Oh, umm, concatenation, minification, JavaScript." and that's entirely what I expected, but it's a huge skew towards only a part of the browser's frame lifecycle.
The Things Chrome Does #
To illustrate the point let me list out the headlines of Chrome's potential workload inside a single frame:
- Dealing with loaded data (image callbacks, styles)
- Parsing HTML into the DOM
- Calculating (and recalculating) styles
- Layout of the page (combining the DOM with styles)
- Painting the elements of the page
- Compositing the painted elements together
- Executing JavaScript and collecting its garbage
Of course the first period of the page likely contains all of these, but each subsequent frame will contain some or (hopefully not, but you never know) all of these. On this view, then, talking solely of concatenation, minification and JavaScript is heavily skewed towards page load time and the computation effort of your own code.
How We See Things #
In Chrome DevRel's Performance team we have a slightly different take on things. We carve up those headline tasks into three areas: Network, Compute and Render.
Network is pretty much what you'd expect and, given the conversations I had with developers, it's well understood. Change formats, reduce the number of requests and reduce the size of the requests. Of course, like anything, there are nuances and things differ a great deal when you factor in mobile radios and highly variable bandwidth.
Compute covers the JavaScript, but actually when you check the list above you'll see that parsing HTML, constructing the DOM (and CSSOM), recalculating styles and laying out the page are all computational in nature. It also follows that it ties in very neatly with your code. By way of example, if you give Chrome a lot of HTML then constructing or modifying the DOM will be more expensive. It sounds obvious, but I think it's often overlooked. It turns out that, unless you're doing something extremely heavy like a game, JavaScript is unlikely to be your bottleneck. (That said, I do think asm.js is pretty darn cool, and I like that people are still trying to push JS performance forward!)
Render is actually my primary focus area, and I would say, as a rough finger-in-the-air measure, that about 80% of the sites I profiled at Google I/O had some form of render bottleneck, so that's what I'm going to talk about a bit. The jobs that come under render are:
- Painting the elements of the page
- Compositing the painted elements together
My plan is to deliver talks later in the year outlining this in more detail, but the painting involves two tasks of interest to us developers:
- Using a software rasterizer to draw elements into bitmaps
- Decoding and resizing images to support the software rasterizer's task
I would say, as a rough finger-in-the-air measure, that about 80% of the sites I profiled at Google I/O had some form of render bottleneck
Both of these tasks are done lazily, i.e. only when needed, and they're remarkably expensive. Take image decoding: I ran a little test where I used a command line C++ decoder on a 2000px square image. It took that decoder about ~100ms to decode the image and it took Chrome ~70ms to do the same. Chrome is exceptionally fast, but bearing in mind that we have ~16ms to get everything done inside a single frame you can see how easy it is to cause a slowdown.
But don't take my word for it, Miller Medeiros had a paint issue recently, and check the final sentence of his tweet:
@aerotwist yes, it did. I had seen/fixed this behavior before, didn't knew overflow:hidden was the cause. Resize/decode are very expensive.
— Miller Medeiros (@millermedeiros) May 27, 2013Of course it all depends on the number of images used, their encoding and dimensions as to how much Chrome has to do, but you get the idea I'm sure.
On the software rasterizing side we're talking about using your CSS to figure out how an element should be painted. Does it have a border? Rounded corners? Shadows? What color is the text? Colt McAnlis from my team has covered this recently, so I'll recommend you read that for more insight.
Changing the Conversation #
We need to change the performance conversation. Network performance is critical, but JavaScript execution is often extremely quick and unlikely to be your bottleneck. The thing is, when you actually profile your sites' scrolling and interactions with Chrome DevTools my hunch is you will see some purple and a whole lot of green.
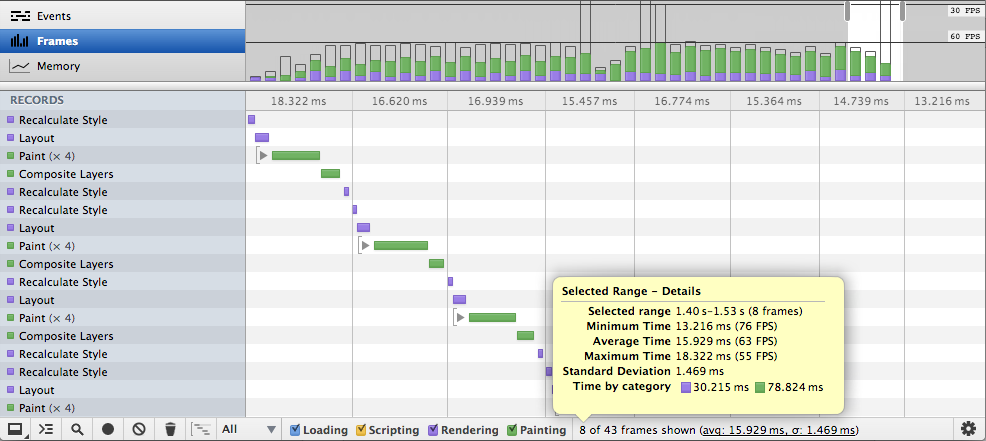
The purple is recalculating style (changing some classes, animating) or layout (where are all the boxes on screen? Do we need to have scrollbars?) and the green is painting or compositing.
Browsers are capable of running at the refresh rate of the device. When they do so our sites and apps feel smooth and crisp. It's nice, users love it. When it doesn't it hitches, hiccups, janks (pick your term of choice) and users don't like it. Users not liking something should be a huge red flag that we need to fix things because they're often our paying customers!
Let's talk differently in our development teams and companies about performance. It isn't just about how quickly it loads, it's also about how quickly it runs. That's what keeps our users happy.