Let's dive in with page load performance. It's all the rage, loading stuff...
Page Load Performance #
Clearly loading stuff quickly is a fine idea, what with everyone being on a cellular connection nowadays. (They’re not, but it’s actually a good assumption if you want to encourage yourself to make things fast.)
Our first port of call in our mission to go faster is PageSpeed Insights (PSI); enter your URL and look at what it tells you do:
Now the thing to bear in mind about PSI is that it’s distilling down a collection of very good (and broad) set of rules and seeing how your site measures up. It doesn’t really care about context or what you chose to do or not do as a team. As such I just tend to see PSI as a checklist of things that are somewhere between “a good idea” and “crucial”, and I don’t aim for a score of 100 across the board.
The reason I’m not going to pin all my hopes on a PSI score of 100 is that it may make my development more difficult. Inlining CSS and JavaScript to pages is one recommendation that it makes, but I think more context is required here. What about caching? What about the actual CSS and JS that it wants inlined? There may be some reasons I have for not doing that like, perhaps, 3rd party, dynamic resources that I just want to link in. It requires a judgement call sometimes.
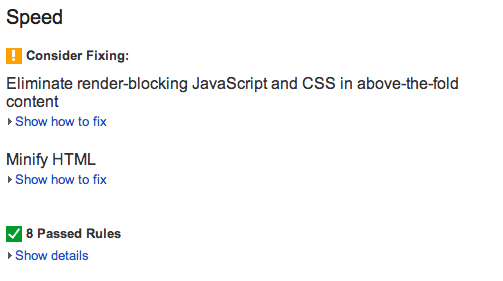
With that said, it still makes very solid recommendations and if it tells you to do something I would say either do it or have a pretty solid reason for not.
In terms of scores I aim for over 85 for mobile and over 90 on desktop.
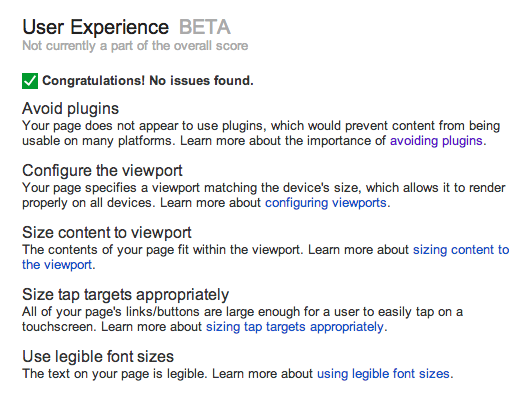
UX #
PSI also includes some new checks on UX issues, like legibility, viewports and touch targets. Messing up UX I am less forgiving of, and so if anything is picked up I’d say the advice should be heeded. Not pure performance, no, but arguably a form of performance is getting out of the person’s way so they can actually do the thing they came to your site to do. Having terrible interactions is something to avoid.
Moar Page Load #
What you actually need is two tools for page performance, not one! If you’ve never visited WebPageTest (WPT) then you’re really missing out. Much as with PSI you can simply drop in your URL thusly:
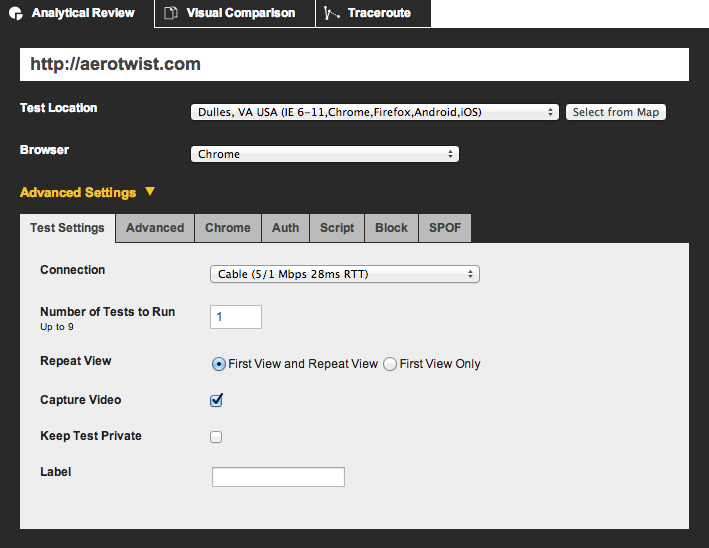
You should also note, however, that there are a bunch of other numbers and settings, like where in the world you want your site tested from, how many runs you want it to do, and whether you care about initial load or repeat views. For a first pass I typically roll with the defaults (Dulles, Chrome, 1 run, initial + repeat) and see how I’m doing. If I am nearing the end of a project and I fancy getting much more reliable data than a single run can provide I’ll go for 5 or 10 runs, and WPT will give me median values.
The WPT results are awesome. You get a waterfall showing all assets, along with the connectivity data (DNS resolution, transfer time, etc), which can be super useful as you try and get a handle of what the heck is going on with your site.
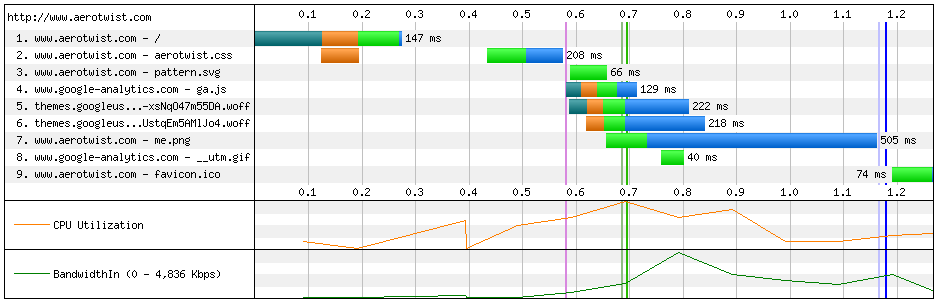
Now, there are things I’m particularly interested in when I look at the results. For one the grading in the top right corner:
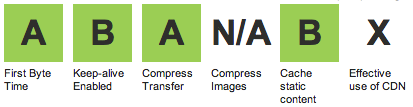
If you’re not getting A's across the board then there may be something there you want to fix.
Next I take a look at the table, and note how long the page is taking to load (document complete vs. actual load). Obviously you want those numbers to be as low as possible, but there’s something we can check that should give us an idea of perceived performance. Since browsers progressively render web pages, we should care about not just when everything was “done” but how quickly we got the majority of the content to screen. That’s where Speed Index comes in. To quote the docs:
The Speed Index is the average time at which visible parts of the page are displayed. It is expressed in milliseconds and dependent on size of the view port.
In short it indicates, in milliseconds, how long a real person would have to wait to have a meaningful form of your page on their screen by measuring not just the end point but how complete the rendering was along the way.
Paul Irish has, in the past, recommended a goal of less than 1,000, and you will not hear this Paul disagree.
Runtime Performance #
This is going to fall into two categories: memory and everything else. I’m actually not going to dive into the deep details of either, largely because I’ve written up a very handy Runtime Performance Checklist, which summarizes all the common culprits and how you should diagnose and fix them. Mostly this step involves Chrome DevTools, because it has all the gear you need to succeed... it rhymes, it must be true!
But here’s in a nutshell what I’m on the hunt for:
- Large invalidations of element styles (recalculate styles) and geometry (layout). It’s expensive to mess with the DOM and render trees, especially as they get larger, so if you can avoid it (heyo class changes on the body element) then do.
- Repeated layout and style changes inside a single frame aka Layout Thrashing. Doing the above repeatedly inside a single frame is way too much, but people do it. They do. Honest.
- Animation of layout properties. Browsers can’t typically recalculate geometry, repaint and composite inside a single frame, so if you animate - say - the width of elements, prepare for your runtime performance to suffer.
- Large paint areas aka Paint Storms. These are typically triggered per frame of an interaction like scrolling or touch / click and, most of the time you will want to promote an element with a transform hack, or wait until will-change has landed.
- Expensive painting. Most people have heard that box shadows are expensive, and yeah that’s kind of true (today anyway, who knows about tomorrow), but actually a single shadow is kind of neither here nor there normally. The key is actually the size of the area (see above) and how much expensive painting that triggers. Not all styles are created equal, so if you have to paint it’s better to make it cheap.
- Badly written touch and scroll handlers. If you don’t have to handle scrolls and touch input, don’t. I know it might be nice to mimic the OS with your scrolly touch physics, but chances are the overhead will kill the frames per second. Some day I hope to say this one is irrelevant, but today it can be a big deal. In any case, if you have to: debounce, bind late and as close to the target as possible, then unbind ASAP.
- Memory churn. You should expect a sawtooth memory graph on a normal day, but the rate at which memory grows and how often it triggers GC should be warning bells.
So that’s my checklist. I go through and see what I can figure out about each one of them, and then prescribe some fixes if there are any. There normally are, although sometimes it’s a case of not doing a particular thing or, if it must be done, at least it’s done in the full knowledge that performance will be taking a hit.
My goal here: 60fps, all the time, everywhere. It’s possible on desktop if you design and build in the right way. For mobile it’s a lot more difficult, but not impossible (depending on what you do. In any case things are getting better (in Chrome land anyway) so hopefully in the medium- to long-term this will be less of a thing.
Go forth and optimize #
Looking at this workflow the most obvious thing I’d say is that it’s very manual work, and it’s crying out for automation. You have to bear in mind that I normally do this stuff in response to direct requests (normally colleagues, it's not something I can scale to the web at large!) for auditing and so were this my own project I might well invest time to automate.
Even if I did, though, I don’t really think the tooling is there yet, but that’s a topic for another day...