The talk is live so you can watch the video if you like, but I also wanted to provide a summary of the salient points in a post because I appreciate not everyone wants to watch a video. If you do watch the video, however, you can see me using DevTools to diagnose issues, which is very handy. I also cover other bits and pieces in more detail.
The TL;DR version #
Tools not rules. Really, just that. I’m advocating for the practice of using profilers, understanding what our code is doing, and fixing our actual bottlenecks.
Performance Advice Considered Addictive #
So often people want to know if A is faster than B, or if C is “considered harmful”. This is problematic for a couple reasons:
- Things change as browser internals change
- It will depend on your specific application: optimizing a game is very different to optimizing a web app that will be open in a tab for days.
In any case I’m acknowledging the fact that we all want our apps to go faster, and we rarely feel that we have the time to devote to profiling our code. Unfortunately as developers we’re responsible for the code we ship, and we have a duty to make it perform well. Code that works quickly (and correctly) is exactly what we’re paid to deliver.
Learn to love the DevTools frame mode #
Before we go much further, you should make sure you know what frame mode is in the DevTools timeline. Essentially it shows you the work that Chrome is having to do to run your app, and it handily includes a line marking 60fps. If your bars are going above that line, you’re busting your budget and your app is going to feel clunky. There’s a Chromium Blog post about frame mode, so check that out if you’ve never heard of it before.
The Performance Cerberus #
Cerberus is a three-headed dog (a mythological one, don’t panic) and is as mean as you can imagine. That fits our view of things here, since performance is a awesome three-headed topic that will bite you in the rear end if you make it mad. Mind you, he guards the Underworld… Okay, let’s park that overstretched analogy right there, and take a look at the three bits of performance we’re interested in: Network, Compute and Render.
Network #
60% of web traffic is images. That’s a huge amount of data. Your users have to pay to download it if they’re on a metered data plan each month (most users in the UK, as one example, are capped somewhere around the 1GB mark on mobile) and chances are your hosting is metered as well: you pay for users downloading files. As such you may want to look at the format in which you’re serving your images. WebP currently offers huge file size savings when compared to the equivalent quality (that quality bit’s important; you can always beat a codec by lowering your quality in another!) JPEG or PNG. If you run your own servers you could do much worse than looking at mod_pagespeed, since that magically optimizes your site on the fly, minimizing and re-encoding assets.
That fits our view of things here, since performance is a awesome three-headed topic that will bite you in the rear end if you make it mad.
Secondly you might want to take a look at the number of requests your site makes. Unless your user is on SPDY or HTTP 2.0 then every file will need to be requested separately, and every request will potentially have a large latency on it. It's worth remembering that bandwidth isn’t latency, so even if you’re on a 3G connection (or better), that doesn’t necessarily correlate to lower latency!
Finally, bear in mind that a request will keep the radio active on a mobile device. The radio is the second most draining item after the screen, so really we want to get it shut off as soon as we can. Otherwise your users will complain that your site destroys battery life, and that’s not a good complaint to have leveraged at you.
Ilya Grigorik is on my team and provides so much good information on this topic. You should totally go and read his articles and slide decks.
Compute #
All our JavaScript runs inside an engine. In Chrome’s case the engine is V8, and like other engines in top-tier browsers, it’s incredibly fast. It’s fast because it watches your code and swaps it out at the function level with an optimized equivalent code.
The first thing you want to avoid is your code being deoptimized, which is where the old, slower code has to be resubstituted back in for the faster version. There are many reasons why this can happen, and they change (reminder: nothing stays the same) so the best thing you can do is to run a tool called d8, which is a standalone version of V8 which will tell you if your JavaScript got deoptimized. For more info check out Optimizing for V8 - Inlining, deoptimizations.
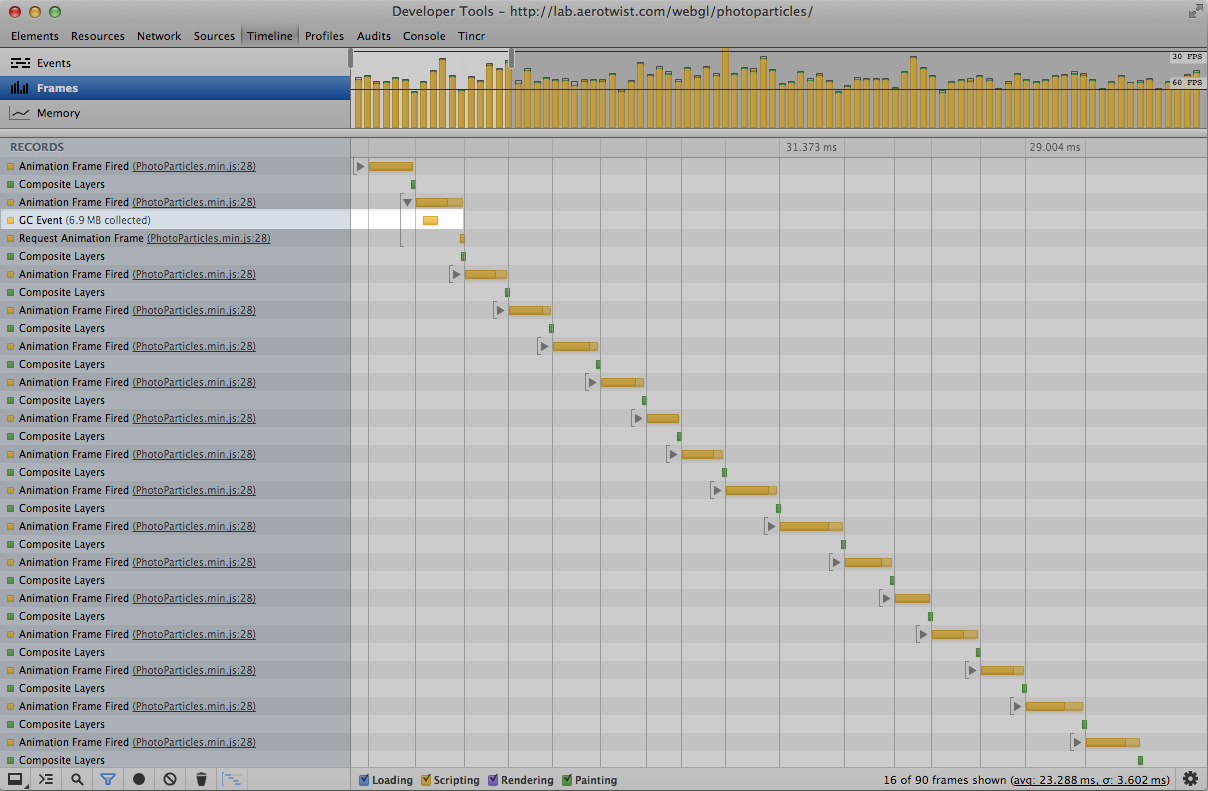
Secondly, since you don’t retain and release memory yourself in JavaScript, you’re at the mercy of the garbage collector. Why? Because memory usage from all your declared objects would grow and grow. You never manually release their memory, so the garbage collector has to come and clean them up when they're not needed anymore. Unfortunately garbage collection (GC) is not free and blocks JavaScript execution while it tidies up. Chrome DevTools handily points out to you when GC has occurred, so you should take time to see if you’re generating a lot of garbage and see if your code is being paused for its collection.
Render #
Your DOM becoming pixels on the screen can be one of the most costly parts of your app’s lifecycle. Crucially when additional painting needs to occur as part of interaction with your app can resulting the app slowing. UI interactions, scrolling, content injections all cause the page to visibly change, and those changes need to be painted to the screen.
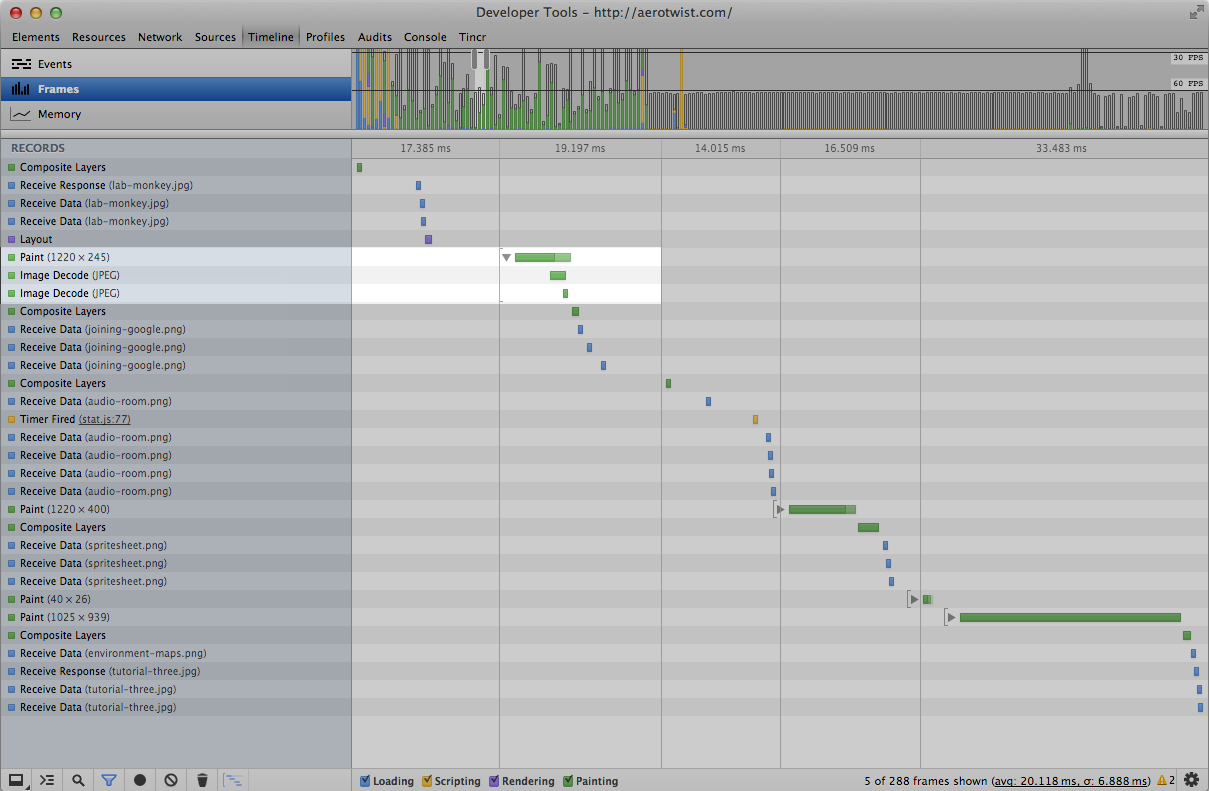
Painting also encapsulates the decoding (you send a PNG, we need a bitmap in memory) and resizing (you send it at 1000px wide for a 300px wide element) of your app’s images. Interestingly there’s a cache available for these decoded images, but if you have a lot of images being decoded soon enough some images will need to be dropped from the cache.
A quick study of the DevTools timeline will show you what’s going on, so again it’s worth checking those out.
Your DOM becoming pixels on the screen can be one of the most costly parts of your app’s lifecycle.
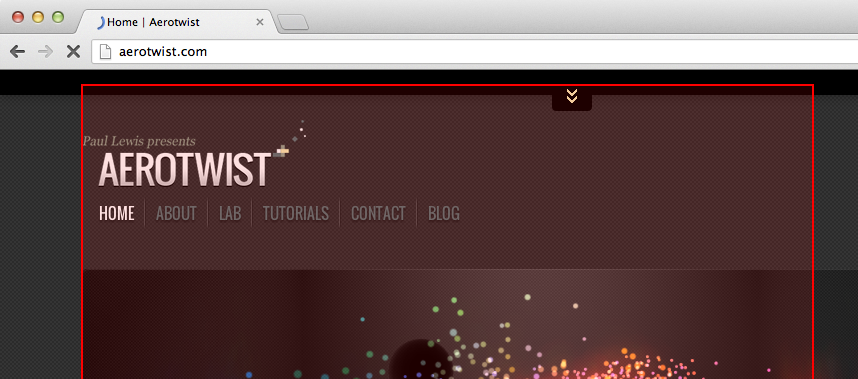
The important thing with painting is first to reduce the size of the paint area. You can quickly assess that with a feature called Show Paint Rectangles in Chrome’s DevTools, which puts a red box around the areas that needed to be repainted. To switch it on head over to DevTools and hit the cog in the bottom right hand corner. From there choose "Show Paint Rectangles".
If you see a full screen flash of red when you scrolled (as one example) the chances are you’re painting more than you thought you were going to. In any case reduce your paint area to the absolute minimum, and verify you're only repainting the areas you meant to.
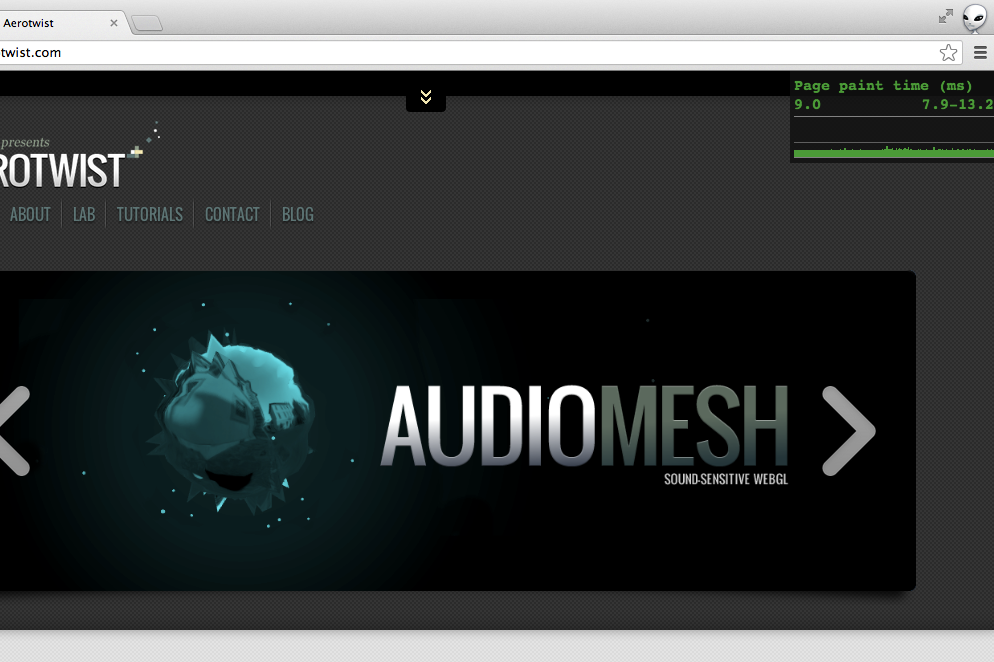
Secondly, assuming you’re painting the minimum, check to see if you have expensive styles. You can do that with the Continuous Paint Mode in Canary’s DevTools, which I’ve talked about before. Essentially it forces Chrome to repaint your page on every frame, and that means you can start toggling elements and styles off to see if and where you have a paint bottleneck. Eberhard Gräther totally has your back here.
Conclusion #
Performance is a big deal, it’s what takes your app from mediocre to great, and we need to take it seriously. A great app means your users will be happier, which in turn leads to more sales and more good will towards you and your app.
Finally, always trust the profilers, and don’t commit specific rules to your head. They change.
Don’t guess it... you get the idea.