Update: 17th May, 2022: Fun to read this now, but this essentially became Lighthouse, so there you go.
I gave a talk at FFConf last week, which was really great (if you get chance to go in future years, do!) and, during my talk, I showed a new tool I've built: Big Rig. Here's what it's for, and how you can use it.

Elevator Pitch #
Big Rig exists to try and give you extended information on what your page was doing during critical RAIL actions.
Big Rig exists to try and give you extended information on what your page was doing during critical RAIL actions, in particular Loading, Responding and Animating. So, for example, it can help you answer questions like: how much time did I spend in JavaScript during page load, and of the time in JavaScript, whose script in particular was the longest-running? Or, during a scroll of my site, what was the fps and how much time did I spend in styles, layout, paint, and composite during each frame?
Big Rig in Two Flavours #
You can get Big Rig in one of two flavours:
- A web-based UI. This is a Python-based app written for Google App Engine that will let you ingest performance data via an endpoint. It will let you do a little bit of management about projects, actions (the things you want to manage), and so on. It's good if you have no performance workflow in place and just want to start tracking things without getting into much config. You can get the Google App Engine SDK and deploy it on your own machine quickly.
- A CLI / Node module. This is the alternative to the web app and the more flexible of the two. You can make the module part of an existing workflow and have it pass data back to some other dashboard or endpoint.

See the CLI / node module repo
To get you the data you want, both flavours of Big Rig ingest traces, which I guess I should explain...
Traces All the Way Down #
A trace is the underpinning performance data format in Chrome (and Opera). As execution passes through Chrome's various subsystems they mark their entry and exit. This results in slices of data, and hierarchies of information, which can then be analyzed. A "full fat" trace from Chrome looks something like this:
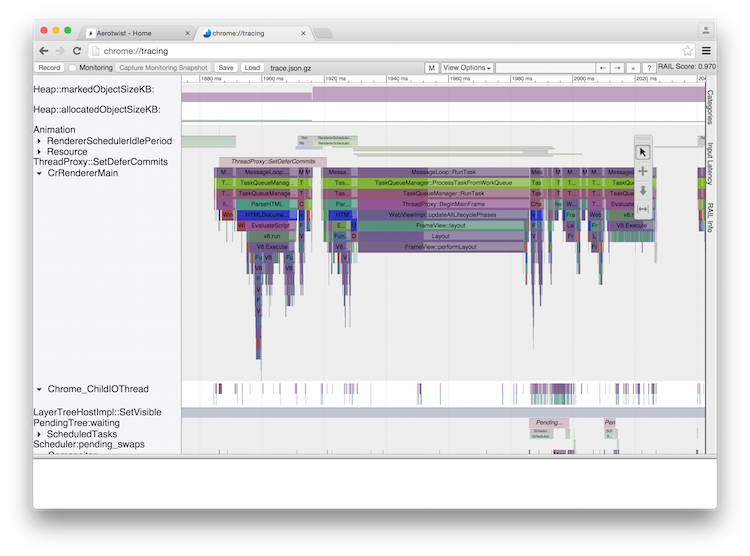
The net result: a DevTools Timeline is a trace, and a trace contains awesome-to-parse data.
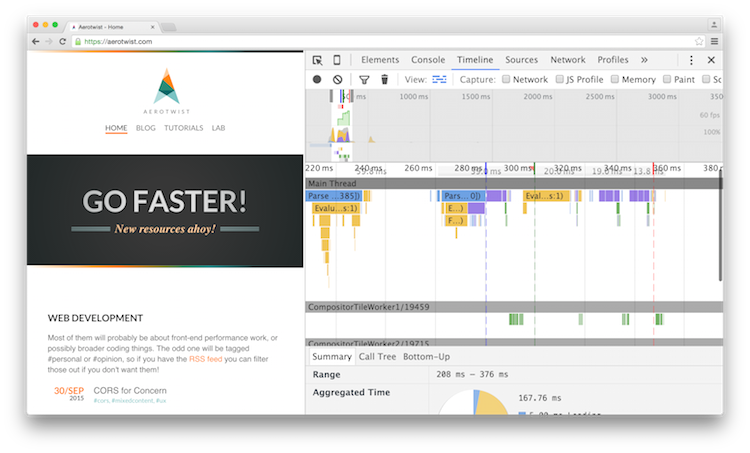
This amount of data is awesome, provided you want it all. Most of us don't want or need it all, and that's why the trace event data is categorized. You can enable a subset of categories, which is exactly what Chrome DevTools does under the hood for its timeline. The net result: a DevTools Timeline is a trace, and a trace contains awesome-to-parse data.
Getting a Trace #
There are a load of ways to get trace files, some being slightly easier than others. Here's how I typically do it.
1. Chrome DevTools #
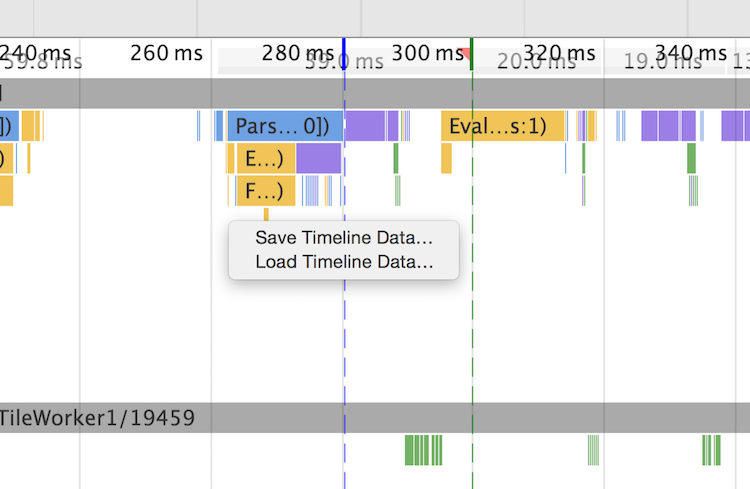
Load a page, go to Timeline and hit Cmd+Shift+R (or Ctrl+Shift+R on Windows/Linux) and you'll get a Timeline that you can save.
Please note: traces contain data for all open processes (tabs), so you need to make sure only the page you want processing is open when you capture the timeline.
2. WebPagetest #
Run a test, but make sure you do it with Chrome or Canary and, under the Chrome options, make sure to click "Capture Dev Tools Timeline":
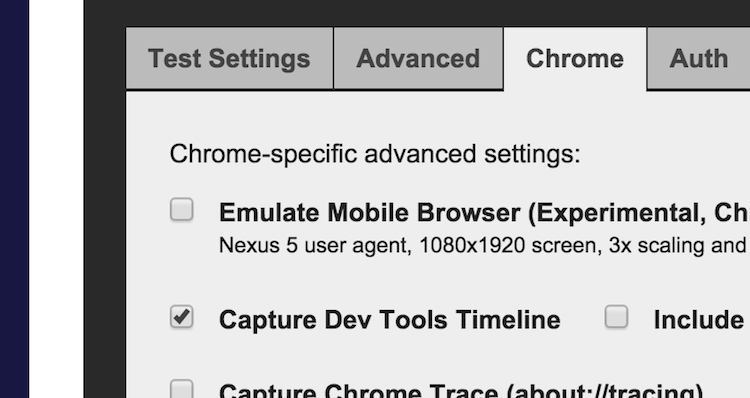
When you get your results you can download the file.
3. Big Rig's Test Runner (Experimental) #
Under the same repo as Big Rig's web app (which I will break out eventually, mainly when I've written tests and it's more mature) you will find a test runner. You can grab it, npm install it and npm link it. That will make it available to you as a command line tool. From there you can run it to do things like scroll tests, and you can even do so on Android devices (by adding the -a flag)!
bigrigrunner -u <url> -s <selector> -o <location>The test runner is the least mature part of Big Rig and doesn't have enough tests for my liking. Not yet, anyway. I'm working on that, though, and the way I look at it is that having a scroll test one command away is a big step forward for many of us!
Parsing Traces #
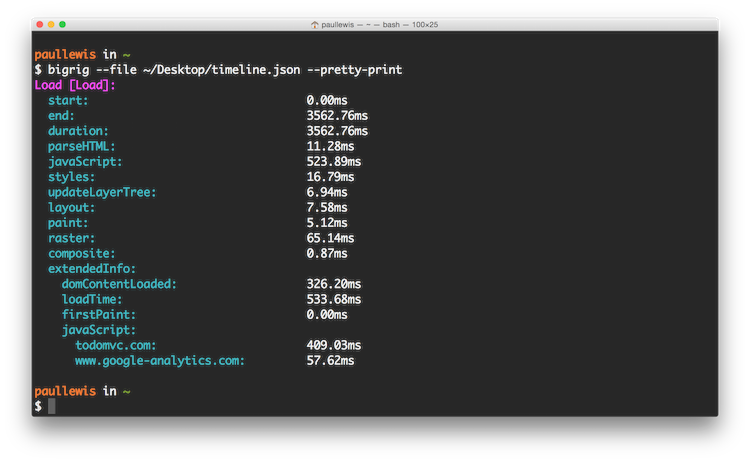
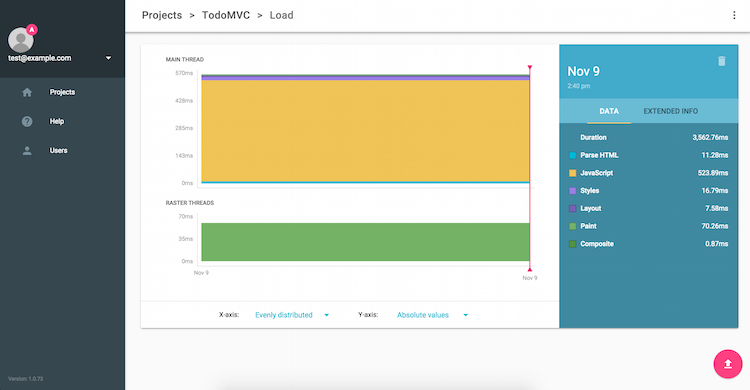
Okay, you have a trace file. Let's assume you got it for a page load, either from DevTools or from WebPagetest. You can now give it to Big Rig to analyze. If you give it to the web app then you'll get charting and what have you, but if you give it to the CLI / module you'll get JSON back. (If you want it looking nicer just go add --pretty-print.)
Or, in the web app:
Big Rig is parsing the trace (via the mighty Chrome Telemetry and Chrome Trace Viewer code - standing on the shoulders of giants here, folks) into a model, and stepping through looking for records of a given type. When it finds them it puts them into buckets, along with additional information, like - say - the origin domain for JavaScript code.
Based on the type of action (or actions) in the trace, you'll see slightly different charting outputs. Animations, for example, have fps information, which aren't present in responses or load actions (since it wouldn't make much sense).
Areas of interest #
If you only want Big Rig to analyze a part of a trace, you can give it timed ranges in your code:
function onClick () {
  console.time("sideNavResponse");

  toggleSideNav();

  // Wait for the next frame so we know
  // that we responded to the user.
  requestAnimationFrame( () => {
    console.timeEnd("sideNavResponse");
  });
}
Big Rig will only analyze timed ranges (if there are any) and will present the data based on the type of action it thinks the range represents (you can override it if you know something is - say - an animation). If you don't have any timed ranges, which is probably going to be the case for WebPagetest or DevTools when loading a page, then Big Rig will assume the whole range matters, and that it's a page load.
Video Walkthrough #
If you prefer watching than reading, this is how to import a trace file from WebPagetest into Big Rig.
Next Steps #
Here are some of things I have on my mind:
- Cross-browser testing. Today all of this is Chrome only, which is on the one hand great, but also I think it's a bit of a shame, since many of us want to test in multiple browsers. Folks like Kenneth Auchenberg have been calling for some kind of standardized protocol for some time (and he made RemoteDebug as part of that effort). I don't think we need to go that far personally, but getting something at least trace-like out of Firefox, Edge, and Safari would be amazing for developers. Then we'd be talking like-for-like in perf tests.
- More test-runner tests. So far I've only gotten scroll and load tests plumbed in. I'd like more, and I'd like to make it easy for others to make their own. That said, the whole thing sits atop ChromeDriver (ohai, shoulders of giants) so if you already have those kinds of tests, then you might be able to hack something together quickly.
It's early days for Big Rig (read: super experimental and in no way an official Google product!), so please have a play, file issues (web app, node module), and just generally let me know what you think on Twitter.